Steven Leathard

I'm currently in a data analytics group focused on healthcare data engineering and visualization projects. I work with both clinical and financial customers to transform data into actionable information, using a mix of SQL, Python, Pandas, R, Vega-Lite, HTML, CSS, Bokeh, Power BI, QlikView, and Cerner CCL.
Some of my projects are listed here with descriptions and links to their repositories. All of these examples are presented here with fabricated data and the identities of organizations removed.
View My LinkedIn ProfileHosted on GitHub Pages — Theme by orderedlist
Portfolio
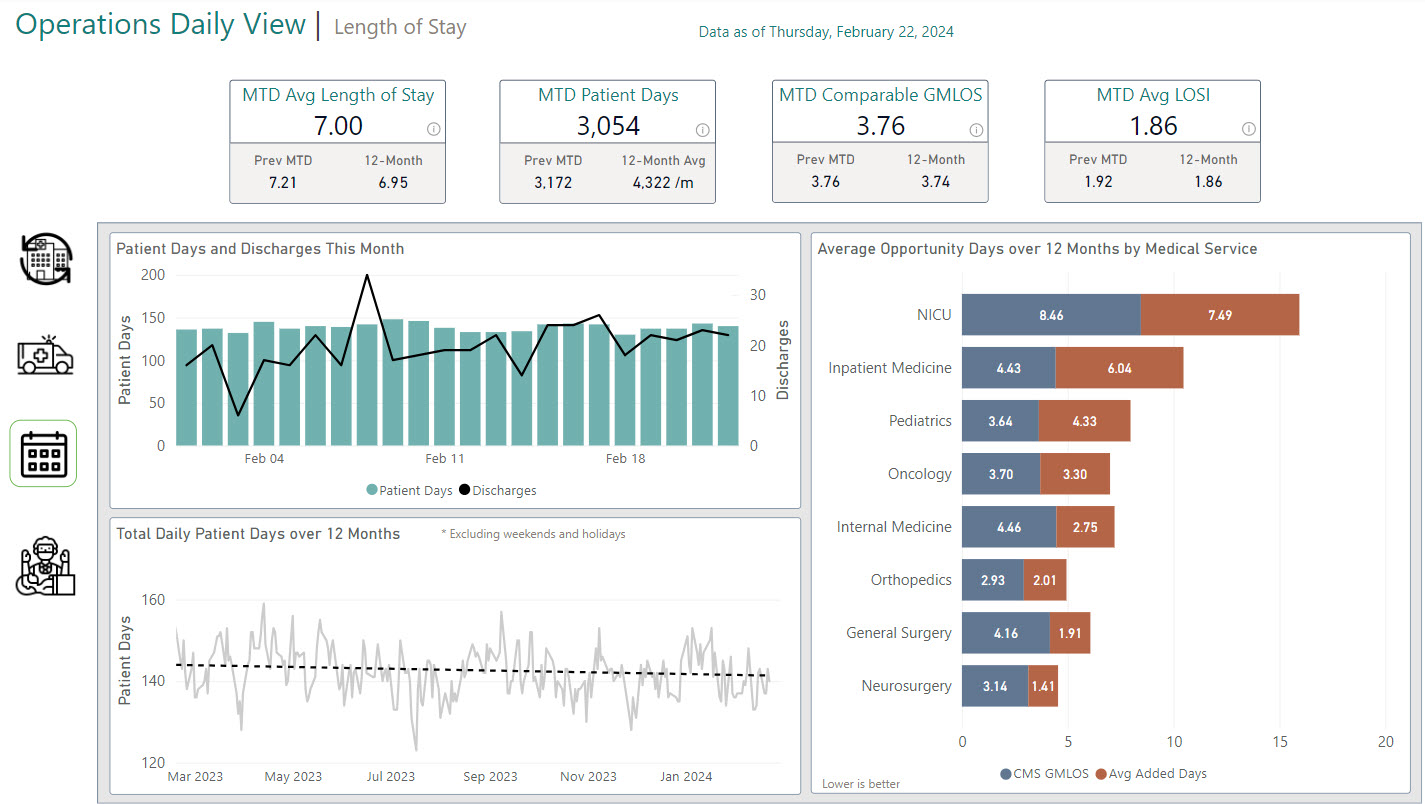
Hospital Operations Dashboard in Power BI
Overview of the report
Example report using Power BI
Presentation and report visuals using R
Visuals for referral conversion rates

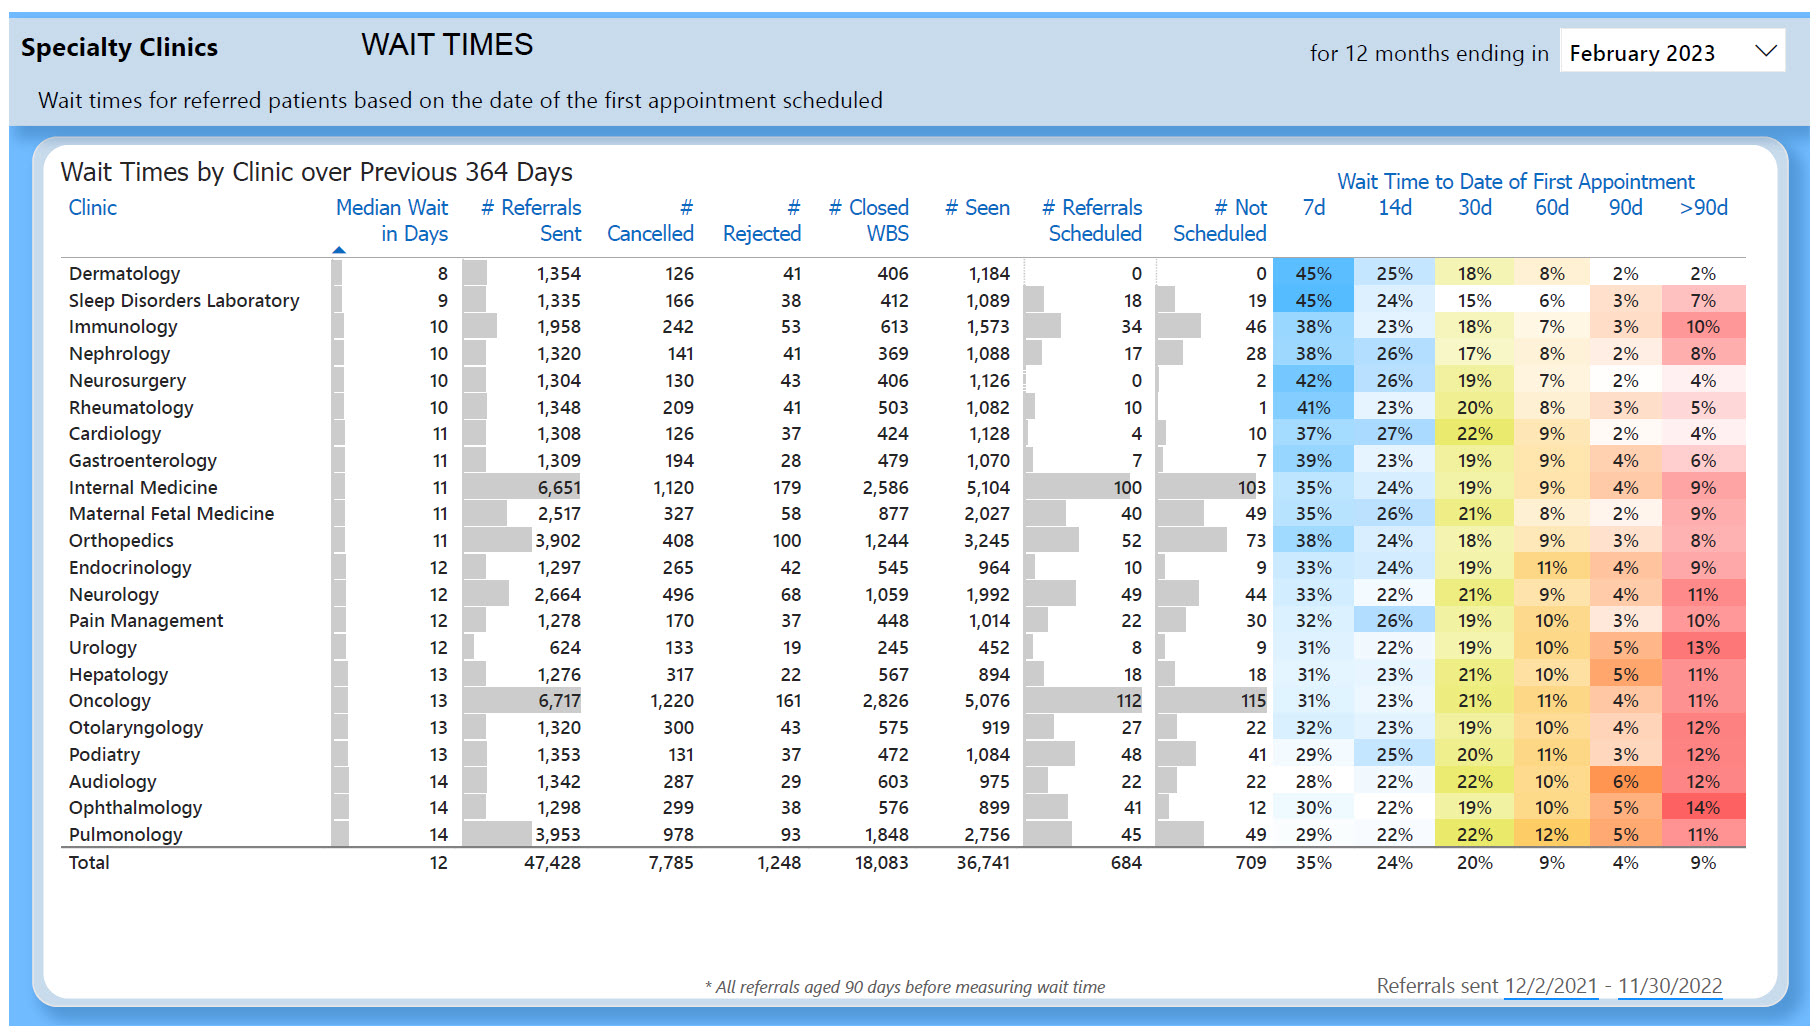
Referred patient wait times at specialty clinics
Overview of the report
Example report using Power BI
Specialty clinic days to see referrals - moving rates
Example data application using Bokeh
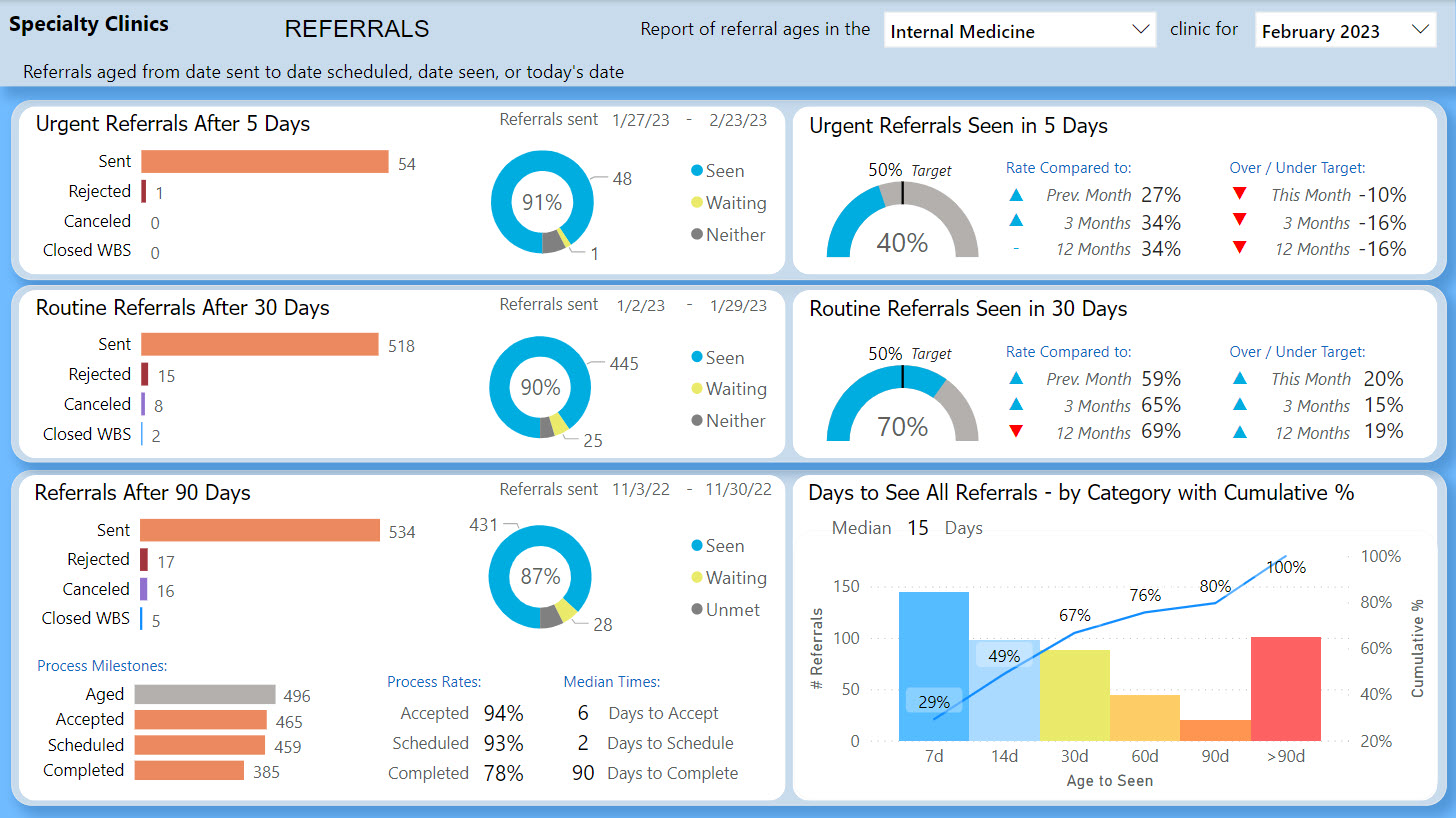
Specialty clinic referral conversion rates
Overview of the report
Example report using Power BI
Example report using Pandas and Bokeh
Python utilities for day to day reporting
Include dashboard pages in PDF reports using Playwright

Splice PDFs and apply bookmarks using PyPDF2 (v3.0+)

Automate report distribution via email using SMTP

Page template forked from evanca
Icons included from a subscription to flaticon