Steven Leathard

I'm currently in a data analytics group focused on healthcare data engineering and visualization projects. I work with both clinical and financial customers to transform data into actionable information, using a mix of SQL, Python, Pandas, R, Vega-Lite, HTML, CSS, Bokeh, Power BI, QlikView, and Cerner CCL.
Some of my projects are listed here with descriptions and links to their repositories. All of these examples are presented here with fabricated data and the identities of organizations removed.
View My LinkedIn ProfileHosted on GitHub Pages — Theme by orderedlist
| < Portfolio | Full Report | Power BI example |
Hospital Operations Dashboard in Power BI
Project description: “Operational” dashboards surface high-level measures that allow executive leaders to monitor the running status of the business or organization, to ask timely questions of the business managers, and to make decisions that optimize their business. Operational dashboards communicate what is important to an organization, and take different forms depending on what is important or timely.
This report is an example of my previous work to create an operational dashboard for a hospital. The specific content was decided upon by conducting interviews to discuss current needs and solicit requirements.
All data in these reports is fabricated and does not represent any real healthcare organization.
The report presents a dashboard with linked pages for each subject area that is covered. There are pages for Length of Stay, Readmissions, Emergency Services, and Surgical Services. The pages are linked by icons in a vertical navigation panel along the left edge of each page. The pages were displayed on a flat panel in an executive conference room by an HTML page with a script that rotates through the pages.
Cards at the top of each page display headline measures, while panels in center view either display movement in the measure over time or display breakouts of the measure by relevant groupings. The cards compare the observed rate during the current month to different periods depending on the measure, such as the previous month-to-date, or the three-month average rate, six-month, or twelve-month rates.
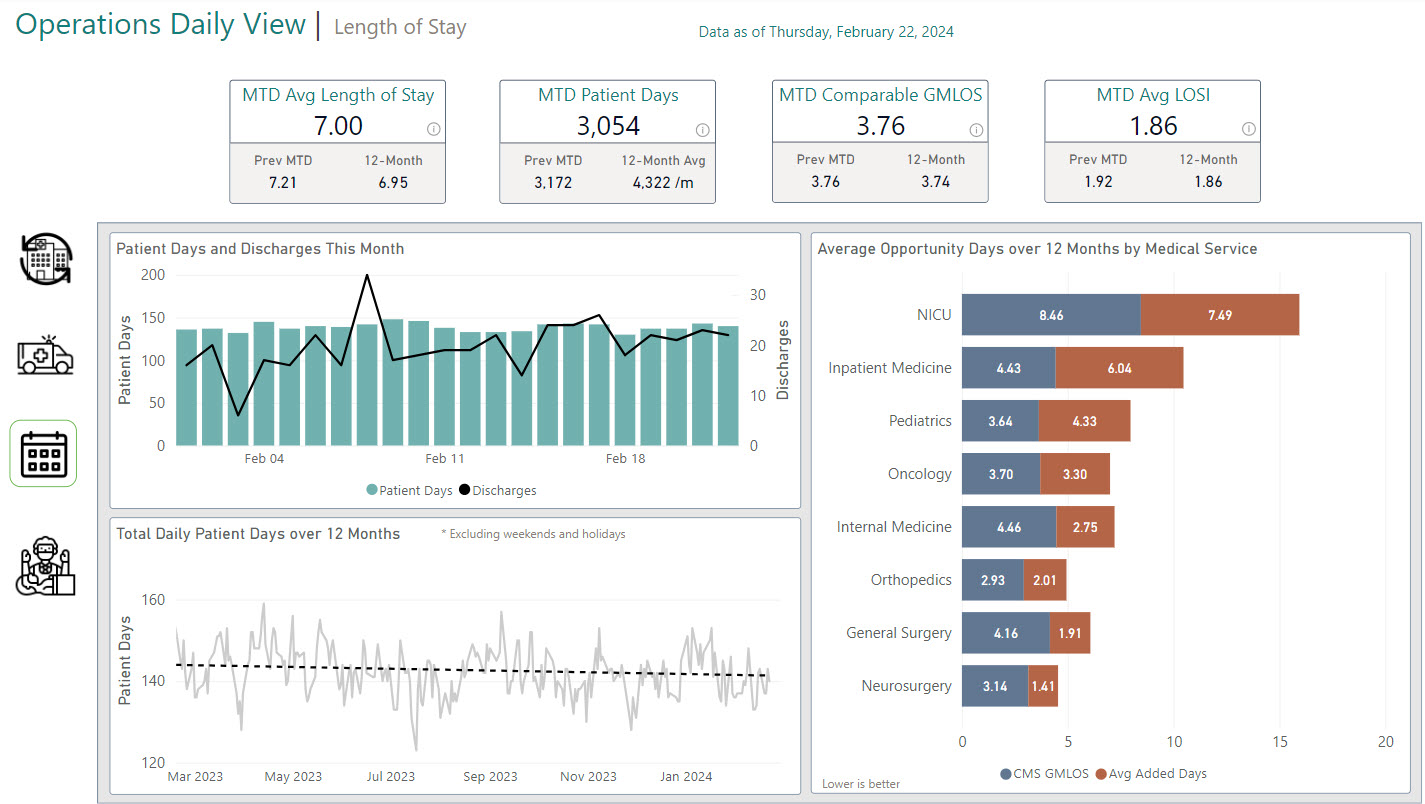
Length of Stay
 Click for full image
Length of stay is the number of midnights, or Patient Days, that an inpatient utilized a bed in the facility. Average Length of Stay measures the average patient days per patient discharged using a common quality control methodology of counting the number of patient days and dividing by the number of discharges in the same period.
This differs from the CMS methodology of counting the patient days for each discharge for a specific DRG and calculating the geometric mean. The CMS Geometric Mean Length of Stay (GMLOS) is a measure of the average hospital stay for a Diagnosis Related Group (DRG). This page calculates a comparable GMLOS by averaging the GMLOS values for all discharges during the period. The GMLOS for a discharge is the CMS GMLOS value for the same DRG.
Average Opportunity Days is simply the GMLOS subtracted from the Average Length of Stay. This is only an overall comparison of the average facility stay compared to the CMS-wide average for the same DRGs. It does not mean that any one patient remained admitted longer than they should have been.
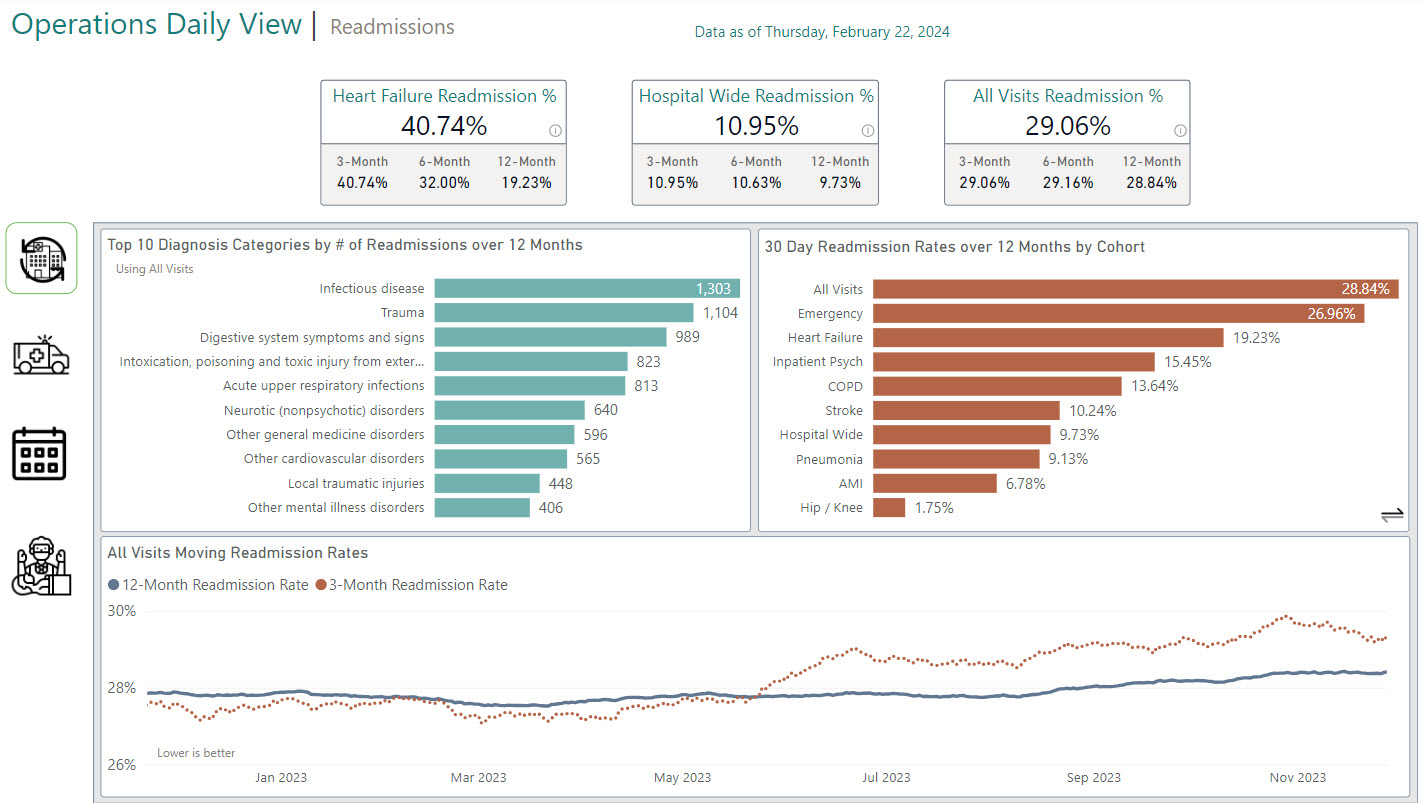
Readmissions
 Click for full image
Readmissions are unplanned admissions to an inpatient facility within a short time after discharge. This page surfaces 30-day readmission rates, or readmissions within 30 days of a discharge. Readmission rates are calculated by sampling “index” encounters that have been discharged into a denominator population. Index encounters are included in the numerator if the same patient was admitted with an unplanned diagnosis within 30 days.
CMS defines cohorts, collections of encounters that have their diagnosis in common. Value sets of diagnosis codes define the cohorts. One cohort is all hospital-wide Medicare patients, and another is heart failure patients. Unplanned readmissions are also defined by value sets of diagnosis codes.
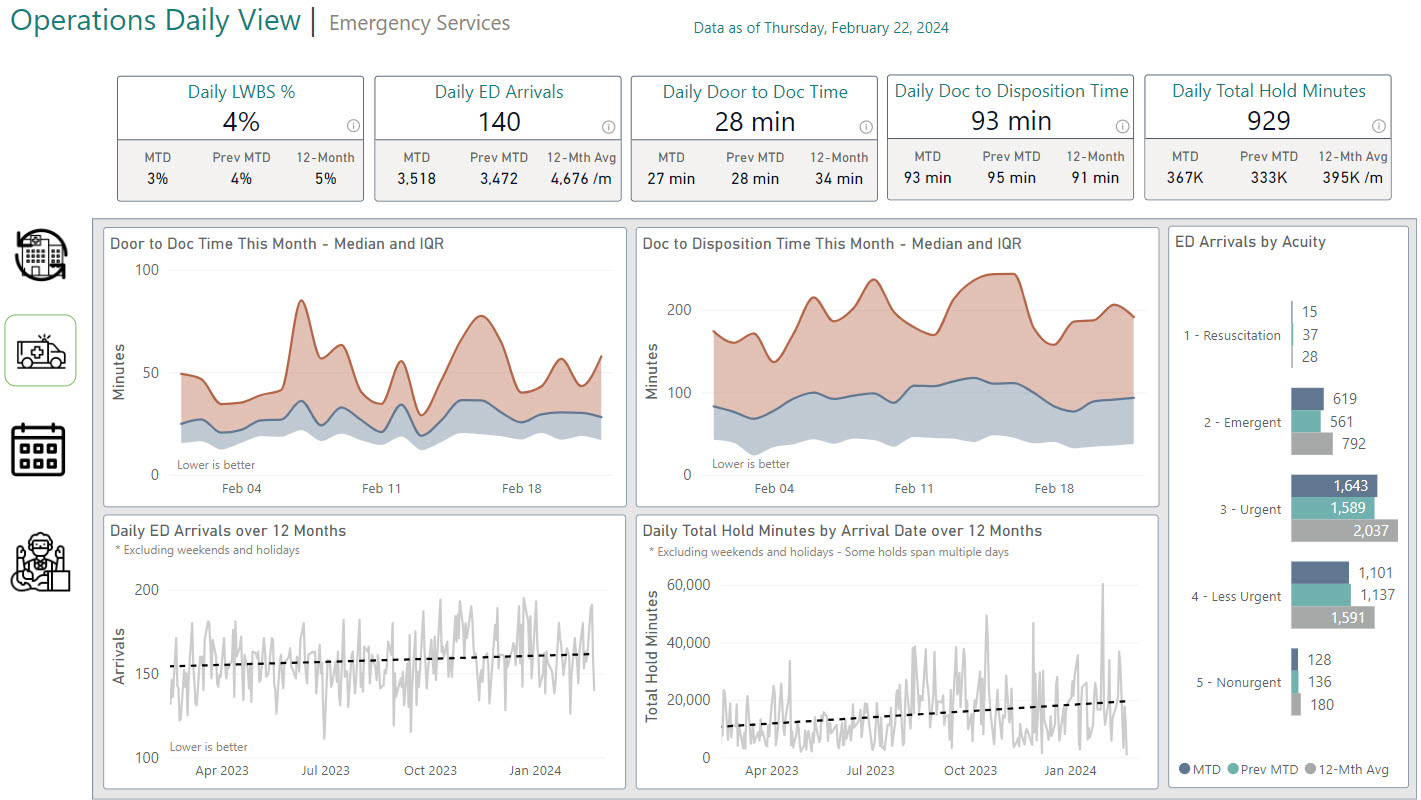
Emergency Services
 Click for full image
The Emergency Services page shows a high-level view of arrival volume, the median wait time to be seen, the median time until the decision to discharge or admit is made (disposition), hold time waiting for an inpatient bed, and patients who decide to leave before being seen by a physician (LWBS).
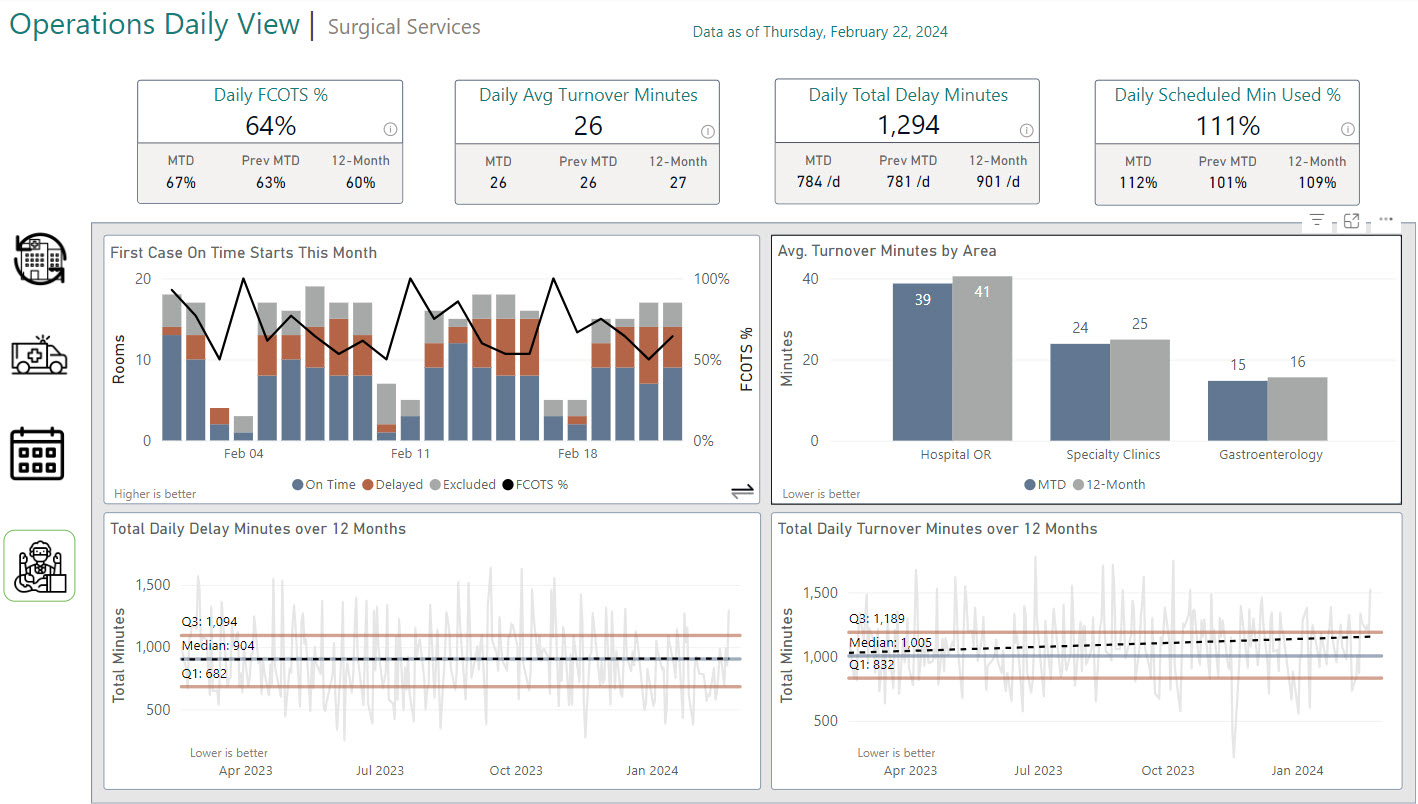
Surgical Services
 Click for full image
The Surgical Services page focuses on leading indicators of operating room utilization such as whether the first scheduled case started on-time (FCOTS), the time to turn over a room between cases, delays in starting procedures, and the amount of time scheduled for cases compared to the time required.
| < Portfolio | Full Report | Power BI example |