Steven Leathard

I'm currently in a data analytics group focused on healthcare data engineering and visualization projects. I work with both clinical and financial customers to transform data into actionable information, using a mix of SQL, Python, Pandas, R, Vega-Lite, HTML, CSS, Bokeh, Power BI, QlikView, and Cerner CCL.
Some of my projects are listed here with descriptions and links to their repositories. All of these examples are presented here with fabricated data and the identities of organizations removed.
View My LinkedIn ProfileHosted on GitHub Pages — Theme by orderedlist
| < Portfolio | Full Report | Bokeh example | Power BI example |
Specialty clinic referral conversion rates
Project description: One way to measure access to care is timeliness. Long delays to see a healthcare provider can speak to availability issues, either a lack of resources or inefficiencies that result in a less than optimal conversion of referrals into appointments. Long delays can also speak to accommodation issues or accessibility issues if patients have difficulty attending their scheduled appointments. This project is an example of a report that I created to look at the process times for referred patients at specialty clinics.
All data in these reports is fabricated and does not represent any real healthcare organization.
Volume and throughput of referrals for a clinic
 Click for full image
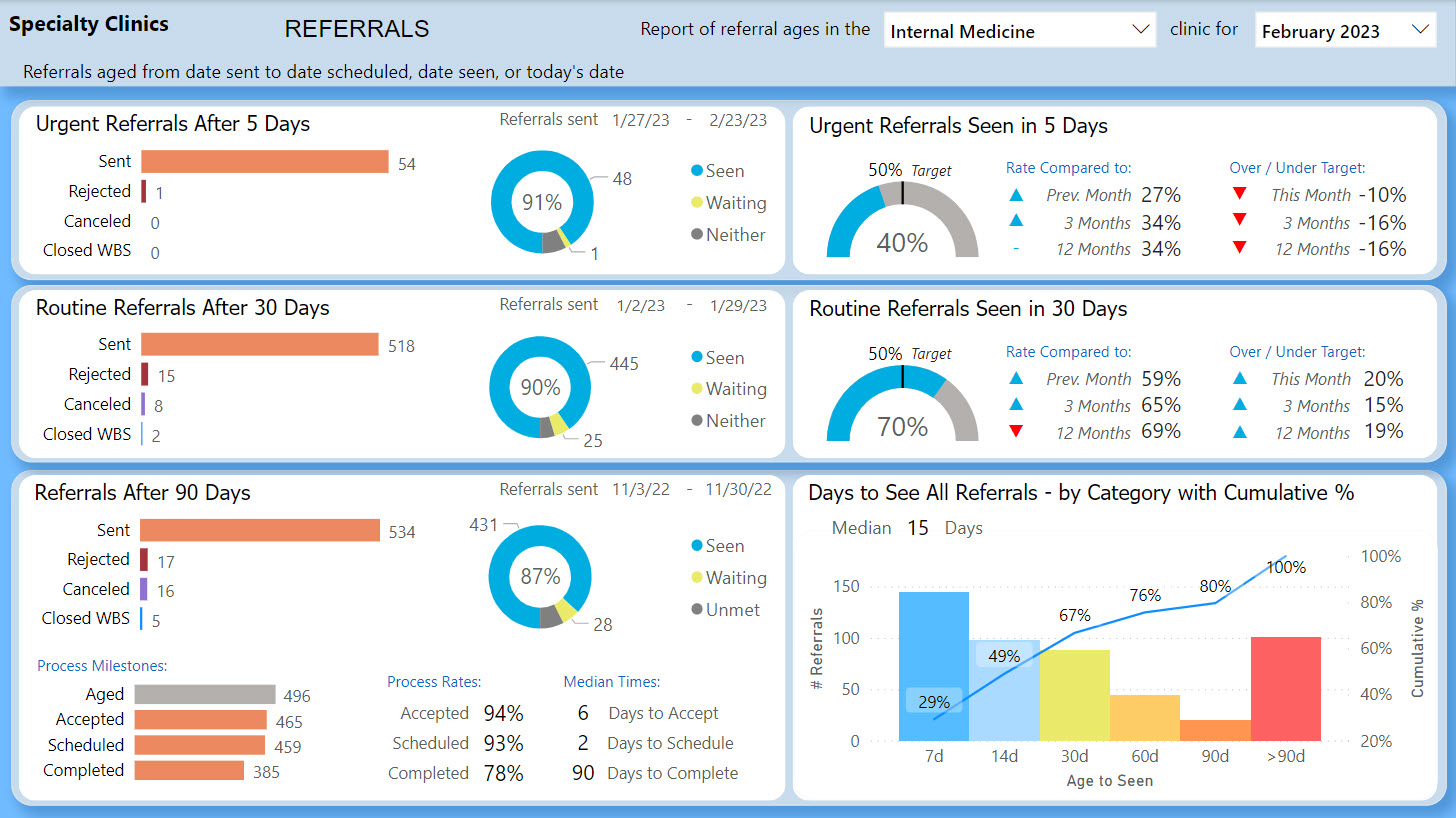
The measures in this report sample all referrals sent to a clinic and age each referral from the date it was sent to the date it reached each milestone in the referral management process. If a referral has yet to reach a milestone it is aged to the date of the report.
There are two process aims displayed in this report: one for urgent referrals to be seen in five days, and one for routine referrals to be seen in 30 days. Referrals are aged to the appropriate number of days for each aim and reported in the month when they reach that age. Any referral not canceled, rejected, or administratively closed is included in the measures. The report shows the percentages of referrals meeting the process aims vs. the target and comparisons against the three-month rolling average and 12-month rolling average.
The percentages of referrals accepted, scheduled, seen, and completed are calculated for all referrals that reach 90 days of age during the month. Median times to reach each milestone are also shown.
Performance and improvement across clinics
 Click for full image
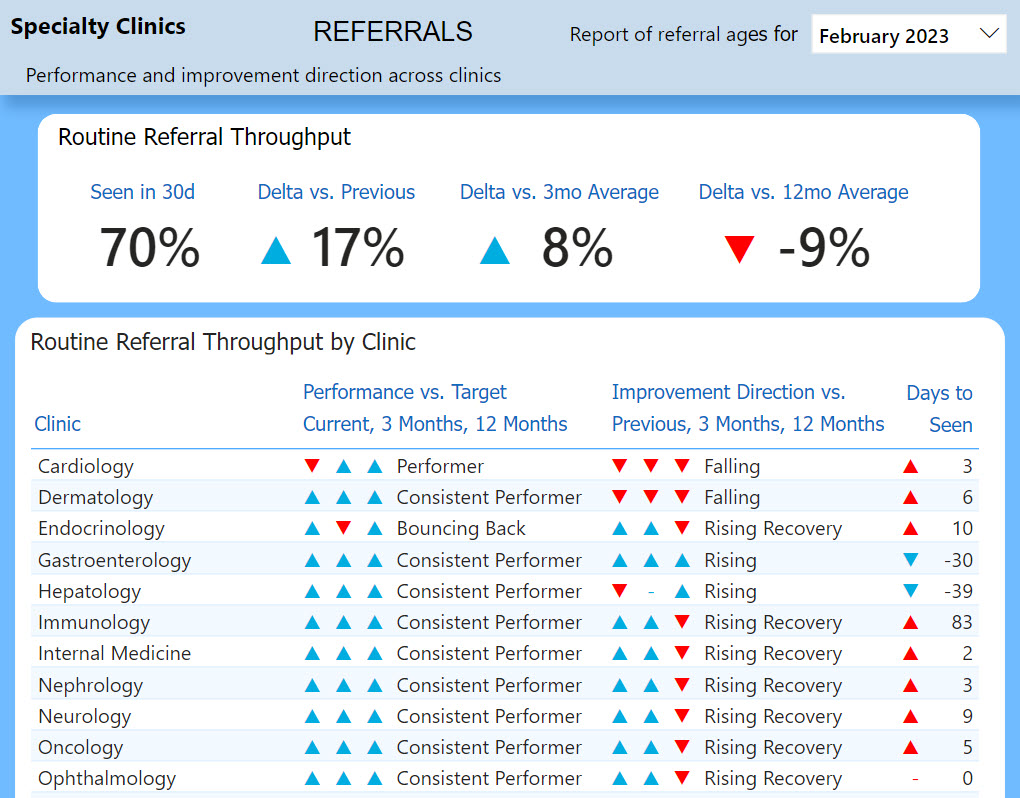
This report seeks a concise way to communicate the impact of recovery plans or the need for recovery plans to improve patient wait times. It compares the performance rates for the current month, rolling three-month average, and rolling 12-month average against the target rate for a process aim. This gives an indication of how consistently each clinic is meeting targets and maintaining that performance. One month under target may not be cause for concern, and one month above target could be celebrated and encouraged for continued performance.
To get an indication of improvement direction within each clinic, this report compares the performance rate for the current month to the previous month, rolling three-month average, and rolling 12-month average rates for the same clinic. If the clinic consistently performs but is moving down over time that should be investigated, and if a clinic consistently underperforms but is consistently rising then the working recovery plan should be sustained.
Stoplight colored indicator arrows represent the performance and improvement direction for each clinic over time to communicate at a glance. Categories infer meaning via a concise statement based on the combination of up or down arrows.
Awareness of holds and delays
 Click for full image
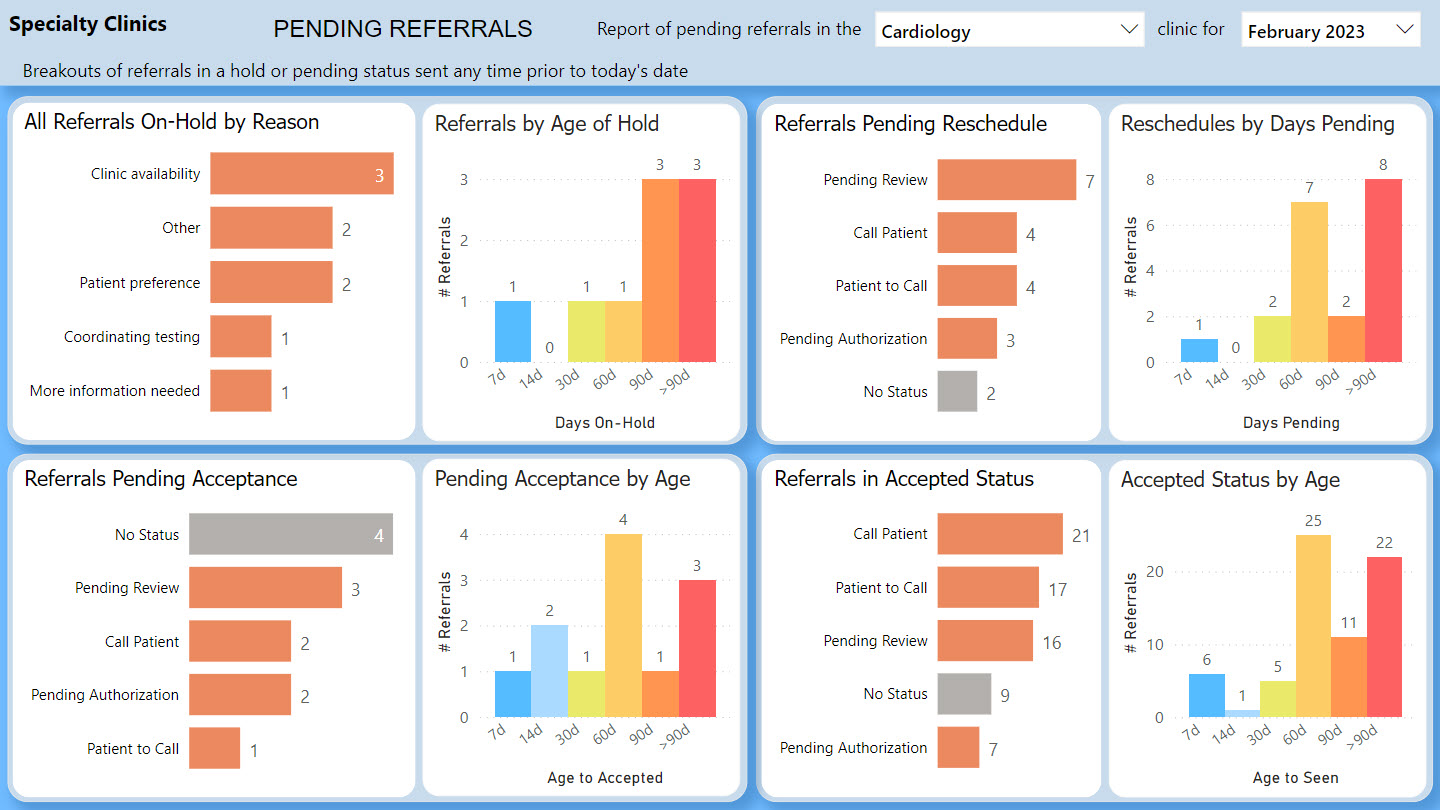
This report provides a snapshot of all referrals that are currently on hold or in a process state that requires more action to convert the referral into an appointment. Clinics can quickly survey the number of referrals awaiting action and how long referrals have been waiting.
Referrals are counted by either the reason for the hold or their current processing status. Referrals can be on hold, pending a rescheduled appointment time, pending acceptance by the clinic, or sitting in an accepted status but not yet scheduled. Stoplight colored histograms count referrals by wait time categories to give an indication of how long the referrals have been pending action.
Data quality
 Click for full image
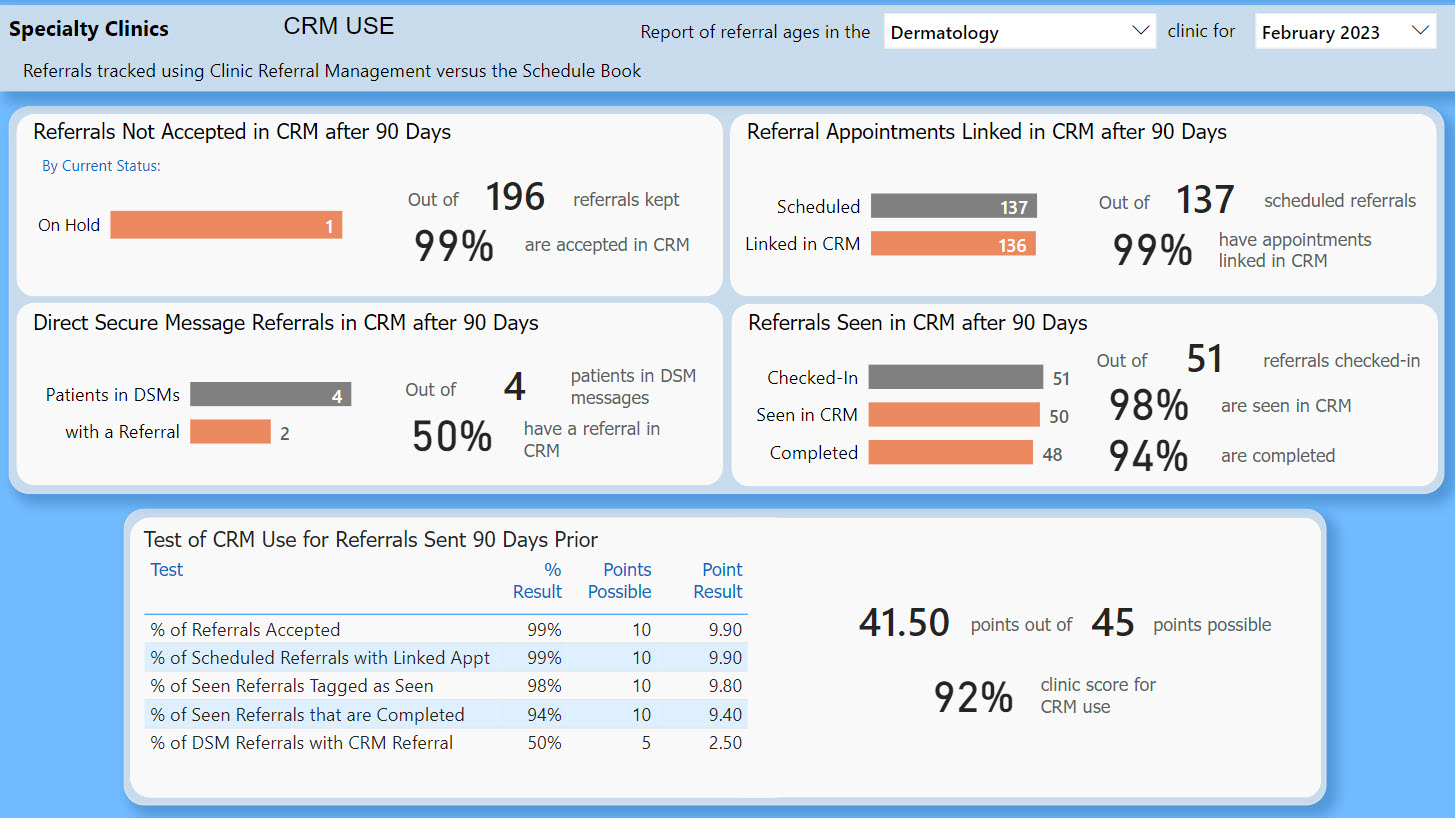
Clinics may not see a further need for the referral once a patient is scheduled. This report addresses the question of how closely the clinic’s referral management data represents patient experience.
Referrals must be accepted, scheduled, seen, and finally completed. In this scenario, referrals must also be linked to the new patient appointments in order to have up to date status in the referral management system. Four tests calculate an indicator of how up to date their referral data is kept. Appointment data for referred patients is compared to their status in the referral management system. Referrals not yet tagged as scheduled may need an appointment linked. This can also cause referrals not to be tagged as seen after the patient has, in fact, checked-in.
The process timing measures consider a referral scheduled if either the referral is linked to an appointment or the patient has an appointment at the clinic after the referral was sent.
An additional test compares the number of patients referenced in Direct Secure Messages to those who have a referral to the clinic. Patients seen as a result of DSMs would need a referral if they are to be included in this report.
| < Portfolio | Full Report | Bokeh example | Power BI example |