Contents
Hosted on GitHub Pages —
Theme by orderedlist
| < Portfolio | Full Report | Power BI example |
Specialty clinic wait times
Project description: One way to measure access to care is timeliness. Long delays to see a healthcare provider can speak to availability issues, either a lack of resources or inefficiencies that result in a less than optimal conversion of referrals into appointments. Long delays can also speak to accommodation issues or accessibility issues if patients have difficulty attending their scheduled appointments. This project is an example of a report that I created to look at the wait times for referred patients at specialty clinics.
All data in these reports is fabricated and does not represent any real healthcare organization.
Wait time to first appointment booked
Click for full image
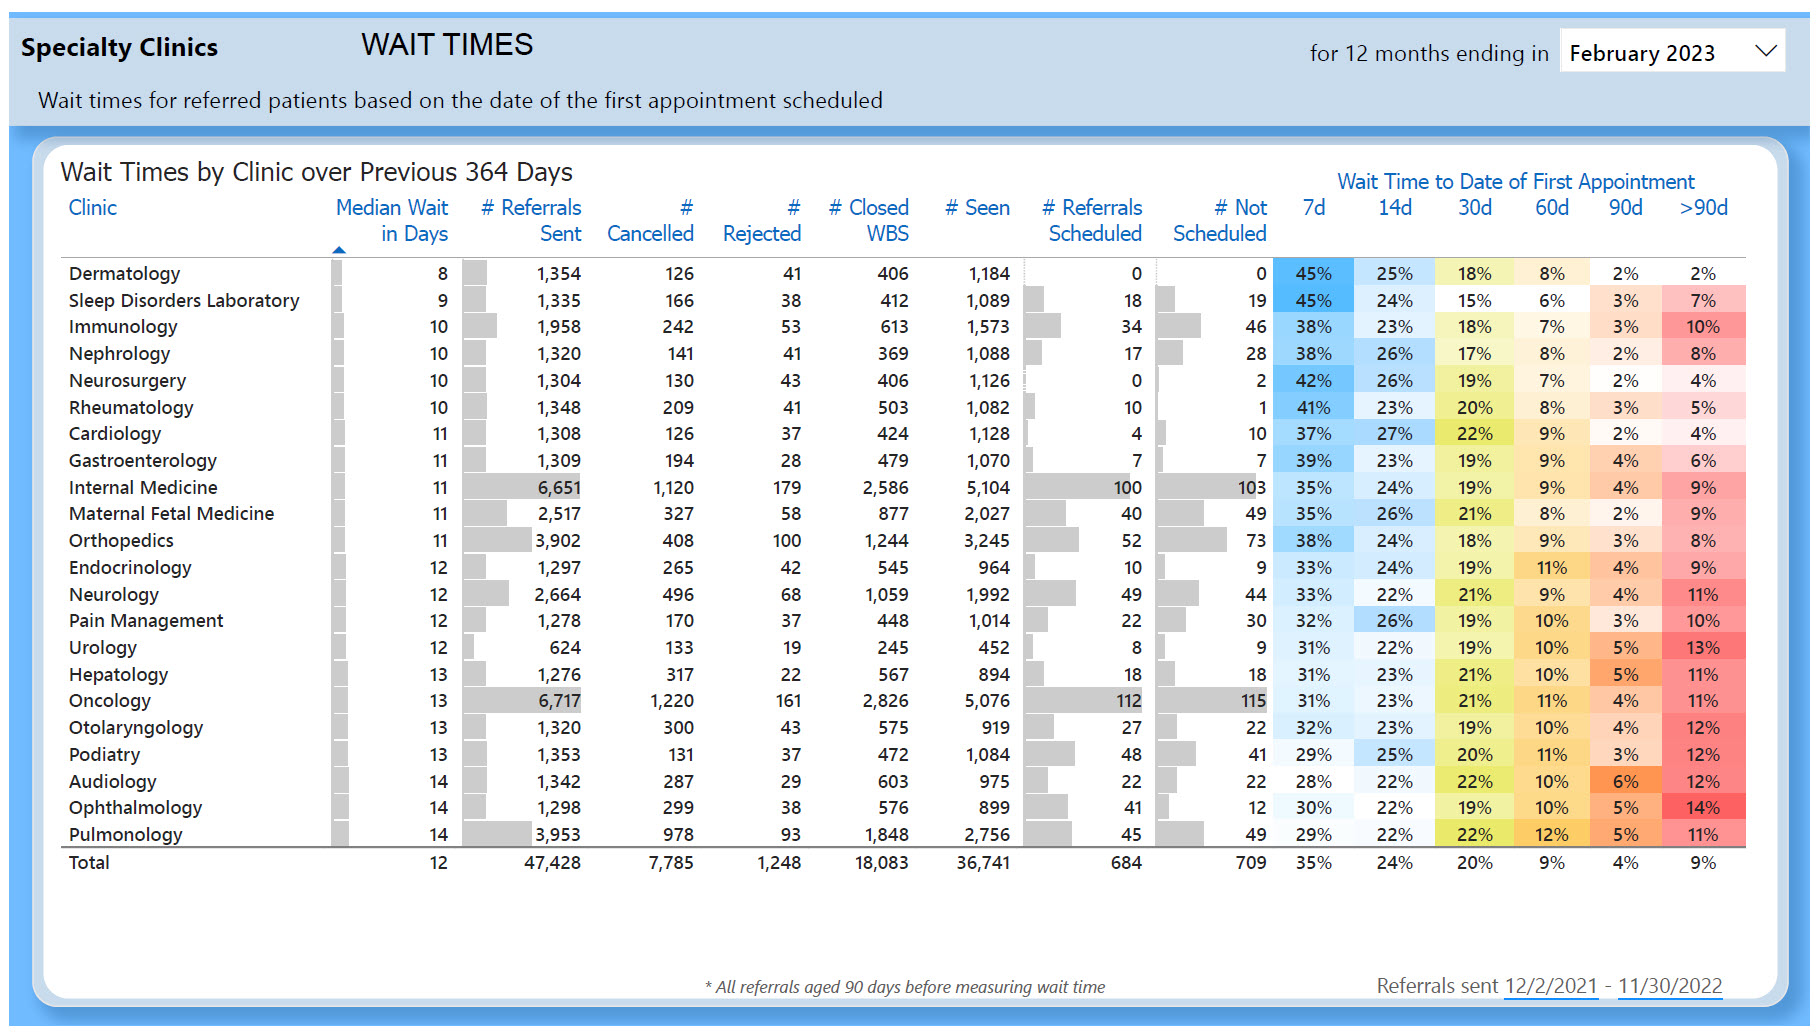
The measures in this report sample all referrals sent to a clinic and ages each referral from the date it was sent to the date of the earliest appointment that was booked for the same patient at the same clinic. If a referral has yet to be scheduled it is aged to the date of the report. The wait time for a clinic is the median age.
This effectively eliminates the effect of no-shows, reschedules, and cancellations to communicate the median wait time that the clinic could arrange with each patient. It still speaks to provider and clinic availability as well as general accommodation for patients who are referred.
Referrals are sampled over a moving 364 day window when the referrals are sent to the clinic. A multiple of seven days insures that the same number of Sundays are included in every sample to reduce jitter in the final result. Referrals must have reached 90 days of age since the date when they were sent to the clinic, even if the referral was scheduled for an earlier date. This is to be consistent with the population of referrals sampled and to avoid skewing the results with more recent referrals that haven’t had the same opportunity as older referrals.
Wait time details for a clinic
Click for full image
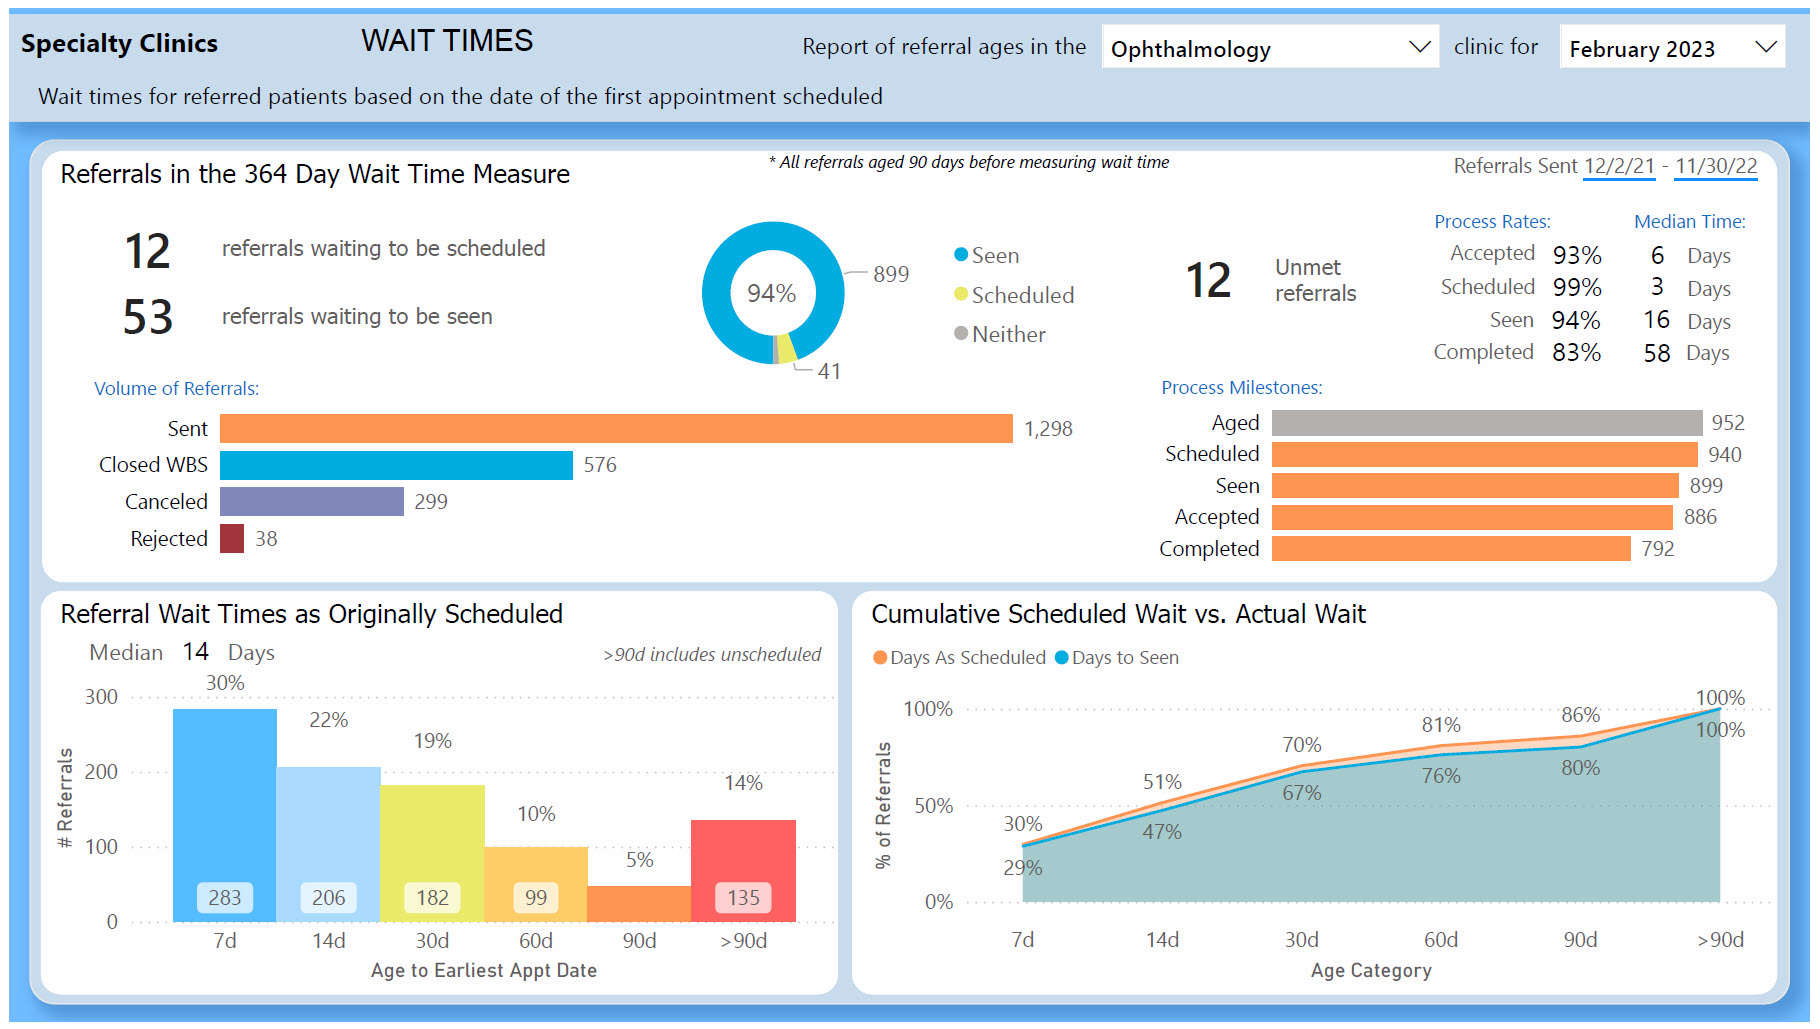
Additional pages in the report surface more detail behind the wait time at individual clinics. Behind the headline of referrals seen, scheduled, or unmet there is a process of accepting referrals, scheduling patients, seeing patients, and completing the visit notes. Referrals can also be rejected for insufficient need or information. Patients can cancel or referrals that are forwarded to third parties can be closed without seeing the patient. The detail pages break down the numbers of referrals that were sent to each clinic by their disposition, processing milestone met, and time to reach each processing milestone.
Two charts create a couple of referral processing curves to help visualize the wait times experienced by patients. A histogram visualizes the referrals sent by the number of days to their earliest appointment broken out by unequal, but meaningful, age bins. An area chart highlights the variance between the ages to the earliest appointments booked and the ages to actually see the patient. This shows the impact of no-shows and reschedules.
| < Portfolio | Full Report | Power BI example |